| MSChartコントロールを操作する(その3) |
| MSChartコントロールを操作する(その3) |
| タイトル関係の設定 (022) 1.タイトルの設定 2.Y軸のタイトルの設定 3.X軸のタイトルの設定 4.脚注の設定 5.X軸のラベルフォントの設定 6.X軸のラベル間隔の設定 7.Z軸のラベルフォントの設定 8.Y軸のラベルフォントの設定 目盛り・表示線関係の設定 1.目盛り・目盛り線の設定 2.目盛り線・区切り線の設定 3.ラベル区切り線・グラフ枠線の設定 グラフの(棒の部分)表示色・ハッチングの設定 1.系列内部の色の設定(棒グラフの棒の色) 2.系列内部のパターンの設定 3.系列内部のパターンの色の設定 4.系列の線(グラフの棒の)ふちのスタイルの設定 5.系列の線 / ふちの幅の設定 6.系列の線 / ふちの色の設定 上記設定は、必要の都度表示設定のプロシージャに記入して下さい。 |
|
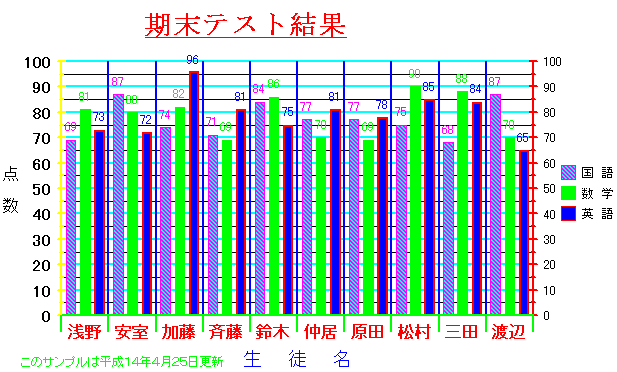
'☆☆★★==== タイトル関係の設定 ====★★☆☆ '====================================================== 'タイトルの設定 With MSChart1.Title 'タイトル文字の設定 .Text = "期末テスト結果" '表示位置 .TextLayout.HorzAlignment = VtHorizontalAlignmentCenter 'タイトルを水平方向に表示 .TextLayout.Orientation = VtOrientationHorizontal .VtFont.Name = "MS 明朝" 'フォントサイズ .VtFont.Size = 20 'フォントスタイル .VtFont.Style = VtFontStyleBold '図表のフォント効果を設定(アンダーライン) .VtFont.Effect = VtFontEffectUnderline 'タイトルの表示色 .VtFont.VtColor.Set 255, 0, 0 End With '====================================================== 'Y軸のタイトルの設定 MSChart1.Plot.Axis(VtChAxisIdY).AxisTitle.Text = "点 数" MSChart1.Plot.Axis(VtChAxisIdY).AxisTitle.VtFont.Size = 12 '1行で書くとエラーになる With MSChart1.Plot.Axis(VtChAxisIdY).AxisTitle.TextLayout 'Y軸のタイトルを縦向き表示 .Orientation = VtOrientationVertical End With '====================================================== 'X軸のタイトルの設定 MSChart1.Plot.Axis(VtChAxisIdX).AxisTitle.Text = "生 徒 名" MSChart1.Plot.Axis(VtChAxisIdX).AxisTitle.VtFont.Size = 14 '1行で書くとエラーになるので注意 With MSChart1.Plot.Axis(VtChAxisIdX).AxisTitle 'X軸のタイトルを水平方向表示 .TextLayout.Orientation = VtOrientationHorizontal .VtFont.VtColor.Set 0, 0, 255 End With '====================================================== '脚注の設定 With MSChart1 .FootnoteText = "このサンプルは平成14年4月25日更新" .Footnote.VtFont.VtColor.Set 0, 255, 0 End With '====================================================== 'X軸のラベルフォントの設定 With MSChart1.Plot.Axis(VtChAxisIdX).Labels(1) '浅野・安室等の生徒名 .VtFont.Name = "MS Pゴシック" .TextLayout.Orientation = VtOrientationVertical .VtFont.Style = VtFontStyleBold .VtFont.Size = 12 If MSChart1.chartType = VtChChartType3dBar Then .VtFont.Size = 24 '3Dの場合は大きく設定して下さい End If .VtFont.VtColor.Set 255, 0, 0 End With '====================================================== 'X軸のラベルの間隔(浅野・安室等の生徒名) With MSChart1.Plot.Axis(VtChAxisIdX).CategoryScale .Auto = False 'ラベルの表示間隔 2=飛び飛びに氏名を表示 .DivisionsPerLabel = 1 '1名毎 'ラベルの区切り 2=2名一緒に一枠に表示 .DivisionsPerTick = 1 '1名毎 End With '====================================================== 'Z軸のラベルフォントの設定 With MSChart1.Plot.Axis(VtChAxisIdZ).Labels(1) '国語・数学・英語(3D表示の場合) .VtFont.Name = "@MS Pゴシック" .VtFont.Size = 24 .VtFont.Style = VtFontStyleBold .VtFont.VtColor.Set 0, 0, 0 End With '====================================================== 'Y軸のラベルフォントの設定 With MSChart1.Plot.Axis(VtChAxisIdY).Labels(1) '左側の 点数の目盛(黒色の太文字部分) .VtFont.Name = "@MS Pゴシック" .VtFont.Size = 12 .VtFont.Style = VtFontStyleBold .VtFont.VtColor.Set 0, 0, 0 End With '====================================================== |
|
'☆☆★★==== 目盛り・線・関係の設定 ====★★☆☆ '====================================================== '目盛り線の設定(点数の横線) With MSChart1.Plot.Axis(VtChAxisIdY).ValueScale .Auto = False .Maximum = 100 '最大値 .Minimum = 0 '最小値 .MajorDivision = 10 '目盛り線の数(等分)10点毎 .MinorDivision = 2 '補助目盛り線等分 5点毎 End With '====================================================== '目盛り及び区切りの線 With MSChart1.Plot.Axis(0).AxisGrid.MajorPen '縦の線(青色) .Width = 23 .VtColor.Set 0, 0, 255 End With With MSChart1.Plot.Axis(1).AxisGrid.MajorPen '横の線(水色) .Width = 23 .VtColor.Set 0, 255, 255 End With '====================================================== 'ラベル線両サイドと下側(一部重複している部分有り) Dim i As Integer For i = 0 To 2 With MSChart1.Plot.Axis(i).Pen .Width = 23 If i = 0 Then '一番下側の線(緑色) .VtColor.Set 0, 255, 0 End If If i = 1 Then '一番左端の線(黄色) .VtColor.Set 255, 255, 0 End If If i = 2 Then '一番右が端の線(赤色) .VtColor.Set 255, 0, 0 End If End With Next i '====================================================== |
|
'☆☆★★ 棒の部分の色・パターン・ハッチングの指定 ★★☆☆ '====================================================== '系列の内部の色の設定(グラフの棒の色) For i = 1 To 3 With MSChart1.Plot.SeriesCollection(i).DataPoints(-1).Brush 'MSChart1.Plot.SeriesCollection(i).ShowLine = False '色の自動設定を解除します。 .FillColor.Automatic = False '色を設定します。 If i = 1 Then '国語 .FillColor.Set 255, 0, 255 End If If i = 2 Then '数学 .FillColor.Set 0, 255, 0 End If If i = 3 Then '英語 .FillColor.Set 0, 0, 255 End If End With Next i '====================================================== '系列内部のパターンの設定(グラフの棒の内部) With MSChart1.Plot.SeriesCollection(1).DataPoints(-1).Brush 'ブラシタイプを設定します。(国語だけ設定) .Style = VtBrushStylePattern 'ブラシで使用されるパターンまたはハッチングを設定します。 .Index = VtBrushPatternBoldDownDiagonal End With '系列内部のパターンの色の設定(グラフの棒の内部) With MSChart1.Plot.SeriesCollection(1).DataPoints(-1). _ Brush.PatternColor '色の自動設定を解除します。 .Automatic = False '色を設定します。(国語だけ設定) .Set 0, 255, 255 '水色の部分 End With '====================================================== '系列の線(グラフの棒の)ふちのスタイルの設定(英語だけ設定) MSChart1.Plot.SeriesCollection(3).DataPoints(-1).EdgePen.Style _ = VtPenStyleDotted 'VtPenStyleDashDotDot '系列の線 / ふちの幅の設定(英語だけ設定) MSChart1.Plot.SeriesCollection(3).DataPoints(-1).EdgePen.Width = 23 '系列の線 / ふちの色の設定(英語だけ設定) With MSChart1.Plot.SeriesCollection(3).DataPoints(-1).EdgePen.VtColor '色の自動設定を解除します。 .Automatic = False '色を設定します。 .Set 255, 0, 0 End With '====================================================== |
|
| ここまでの設定結果 ここへ表示の関係上実際の位置・大きさ等が異なります。  |
|
2002/04/22